The next AI leap will not come from a bigger model. It will come from the people who work with it. And for the first time, you can see exactly where they stand.
The licences are bought. The pilots are running. The policy is written, or at least on the roadmap. And still, less is moving than expected.
That, if you pause on it, is excellent news. Because it means the problem does not sit in the technology. The models work. The infrastructure is in place. What is missing is a view of the layer in between: the people who have to do something with it every day. That layer is not a soft factor and not a leftover. It is where the entire investment either lands or does not, and it is the one layer most organizations have never measured.
The organizations that lead over the coming years will not do so because they picked the best model. They will lead because they were the first to understand where their people stood, and then acted on it.
What actually holds people back
The resistance you meet is rarely a fear of technology. Research describes AI anxiety as a psychological response to fast, systemic change, not as a distaste for tools (HRD America, 2026). That distinction matters, because it determines what works.
The figures show the scale. 51% of employees feel more pressure than a year ago, and 48% end most working days mentally exhausted (Workhuman, 2026). Among more than 1,500 full-time employees across five countries, almost a quarter reported worsened mental health from information overload, and a similar share a reduced sense of control over their own future (Spring Health, 2026). AI is not the only cause of that, but it is the change layered on top.
The question beneath all those figures is rarely “will I lose my job”. It is “do I still matter”. That is a question you can answer, but only if you know for whom it is live.
Whoever looks only at the stack is measuring half the reason AI does or does not work.
AI readiness has three axes, not one
In practice, readiness is measured as a technical property of the organization: data quality, infrastructure, governance, use cases. Valuable work, and precisely the part of the problem that is not the bottleneck. Only 13% of organizations are fully AI-ready by that yardstick (Cisco, 2025), and on another scale, in 2025 fewer than 1% scored above 50 out of 100, though that average recovered to 51 in 2026 (ServiceNow, 2025).
A complete picture needs three axes.
- Usage. Who touches which tools, how intensively, at what cost. This data usually already sits in your telemetry and metadata, without you having to ask anyone anything.
- Engagement. How people relate to the work and to the change: understanding of the why, trust, perceived autonomy, willingness to commit. Measuring engagement alone is no longer enough in an AI-driven environment (WTW, 2026), but without this axis every explanation for what the usage data shows is missing.
- Performance. What people actually deliver. This axis is almost always left out of readiness measurements, yet it determines whether usage and enthusiasm land in any result at all.
The analytical premise is that the three do not run in parallel. Whoever uses AI the most is not automatically whoever performs best. Nor is whoever is most engaged. A measurement on a single axis therefore produces systematically wrong conclusions: perception alone labels critical but productive people as checked out, usage data alone does not explain why someone is stuck, and performance alone says nothing about how durable that result is.
An average is not a mirror
Suppose your organization scores 68 out of 100. Adopting. Strong on talent, weak on governance. That is useful steering information at board level, and at the same time worthless as the basis for an intervention. An average describes a reality that no one in the company actually experiences.
Segmenting by team is the first step, and immediately the smallest. IT at 95, Sales at 90, Operations at 65, Finance at 55: that gap alone already determines where an intervention has effect and where it is waste. But teams are rarely homogeneous, so that layer keeps producing averages too.
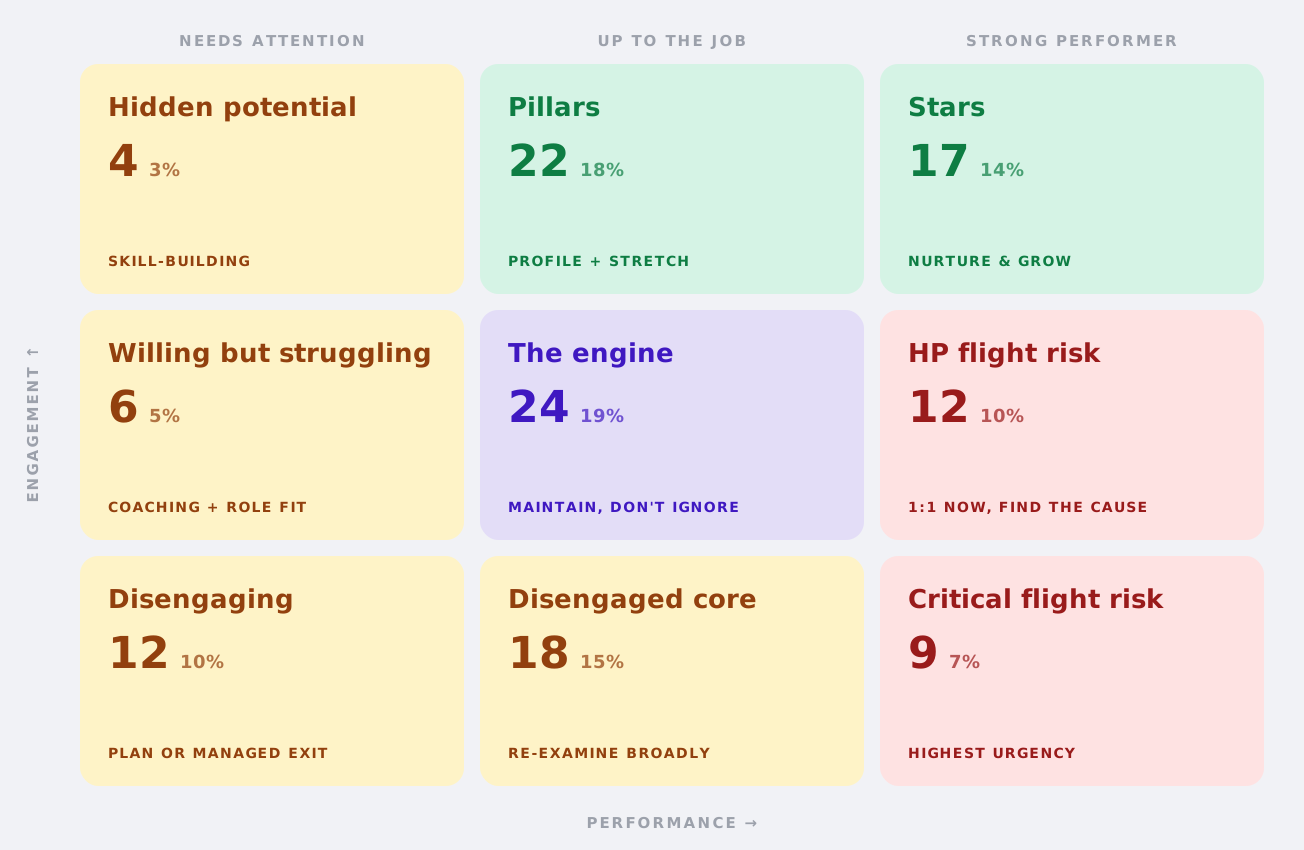
The interesting step is the second: plotting the axes against each other. Set engagement against performance and nine segments appear, each with its own intervention logic. The largest group usually sits in the middle, average on both axes. That is not a grey mass but the load-bearing layer of the company, and precisely the group that adoption programmes routinely skip in favour of the extremes. Bottom right sit people who perform at the top while their engagement drains away. Top left is the reverse: fully engaged, not yet performing, and therefore the place where the gains are quickest to make.
The third axis: from what people think to what people do
So far this is a flat matrix. Two axes, nine cells, a usable picture. The leap comes when you add usage as a third axis.
Conceptually, this is what happens. The matrix stays the same, but it gains depth: the same nine cells now exist in three layers, from low to high usage. An employee is no longer in a cell, but on a coordinate.
That is more than resolution. The three axes measure the same story at different moments, and that is the real reason to add the third. Performance tells you what has already happened, and moves in quarters. Engagement tells you how it feels now, and moves in months. Usage is behaviour, it is continuously measurable, and it bends in weeks. It is the only signal in the model that runs ahead of the other two.
Usage does not tell you who is good. It tells you where you are still in time.
In practice this produces profiles you could not tell apart before. A disengaged employee who avoids AI needs something very different from a disengaged employee who uses it every day without feeling anything about it. A top performer whose usage has been declining for weeks while the numbers still look fine is the earliest departure signal you can have. And someone who uses everything you offer, is fully motivated, and still does not progress, does not have a training problem but a role problem.
At the top end it gets sharper too. The people who score high on all three axes are not simply your best employees. Their way of working sits in the system rather than in their head, and is therefore transferable. That is your smallest group with the greatest leverage, and usually also your most realistic rollout plan.
The more axes you cross, the richer the picture, and the more segments there are than you can serve. The follow-up question thus becomes strategic rather than analytical: do you invest in the ambassadors, in the large middle group, or in those at risk of dropping out? All three are defensible. None of the three is actionable without knowing who sits where.
A segment is a symptom, not a diagnosis
A segment tells you where it chafes, not why. Two people can land in the same cell for opposite reasons: the first does not use AI because policy does not allow it, the second because the skill is missing, the third because the point is not clear. Those three interventions are not interchangeable.
elli’s approach works by the same logic as the classic JD-R and SDT models, but applied to the AI domain: job characteristics are correlated with job experience. Job Demands-Resources shows when AI works as a resource and lowers workload, and when it lands as an added burden on top of existing work. Self-Determination Theory explains why usage without autonomy, a sense of competence or relatedness quickly drains away. From that correlation the cause follows: a lack of being allowed to, being able to, or wanting to.
A systematic review confirms the mechanism: when people understand why change is happening and how they fit into the future, wellbeing improves and engagement rises (Frontiers in Psychology, 2026). Clear communication shrinks the space in which uncertainty grows. A measurement is therefore not an endpoint but a question: the data delivers the segments, the conversation delivers the cause.
Adoption is a change journey, not a rollout plan
Most frameworks stop at the technical, and that is where it comes apart. In 2025, 42% of companies abandoned the majority of their AI initiatives, up from 17% a year earlier (S&P Global, 2025). Gartner expects that more than 40% of agentic-AI projects will be scrapped by the end of 2027, due to rising costs, unclear business value or inadequate risk controls (Gartner, 2025).
The organizations that escape that fate treat adoption as change and not as installation. elli’s approach follows the ADKAR methodology (Awareness, Desire, Knowledge, Ability, Reinforcement) and so gives that journey an order: without an understanding of the why and the desire to come along, no training lands. Only then follow knowledge, ability and reinforcement. They measure what people think and what people do: a survey across the three dimensions, alongside the usage data their systems already keep. Asking alone yields an opinion. Asking and measuring yields evidence.
The hardest axis is the most important
Of the three axes, two are effectively already filled in. Usage sits in your telemetry: who touches which tool and how intensively is objective, continuously available and asks no one to cooperate. Performance sits in your existing cycle. Both axes can be built without a single person having to fill anything in.
Engagement is the only axis you have to actively gather. And it is at once the only one that explains what the other two mean. A falling usage figure is, without experience, a number without direction: you see that someone is checking out, but not whether that comes from a lack of time, distrust, a poor use case or work that has changed in the meantime. That is exactly where the intervention sits.
Where the real work is
Reach everyone, not just those with a mailbox.
A measurement that reaches 30% of an organization, mostly the desk roles, produces a skewed picture that is more dangerous than no picture.
Measure short and often instead of long and yearly.
Experience changes faster than an annual cycle can follow, and the window between signal and departure is small.
Gauge experience, not satisfaction.
Satisfaction measures whether someone is not complaining. Experience measures whether someone still believes they matter, and that is the variable that moves.
Read direction, not level. Not “how does the organization score”, but “which team has been moving the wrong way since spring, and what changed there”.
The quality of your whole model is therefore set by the axis that is hardest to capture. Whoever puts the time into that gets two free axes on top that suddenly carry meaning.
What you gain
The optimistic scenario is not that AI will work by itself. It is that the bottleneck is visible and therefore solvable. As WTW puts it: organizations that deliberately design their employee experience to address this uncertainty can replace it with trust, and show people that they still matter (WTW, 2026).
For most organizations, AI is not the biggest risk. Not being ready for it is. And being ready does not begin with the technology, but with a view of where your people stand.
At elli we bring those three axes together in one journey, from measurement to segments to intervention.
Sources
- Cisco, AI Readiness Index 2025: cisco.com
- Dataiku & The Harris Poll, Global AI Confessions Report: CEO Edition (2026): businesswire.com
- Frontiers in Psychology, Dimensions of artificial intelligence anxiety among employees (2026): frontiersin.org
- Gartner, Over 40% of Agentic AI Projects Will Be Canceled by End of 2027 (2025): gartner.com
- HRD America, How can employers address AI anxiety in the workplace? (2026): hcamag.com
- S&P Global Market Intelligence, Voice of the Enterprise (2025), via secondary analysis: pertamapartners.com
- ServiceNow & Oxford Economics, Enterprise AI Maturity Index 2025: servicenow.com
- Spring Health, The Hidden Cost of AI Anxiety (2026): springhealth.com
- Workhuman, Humans at Work Barometer (2026): workhuman.com
- WTW, Fear of Becoming Obsolete (2026): wtwco.com